K8S DASHBOARD Guide
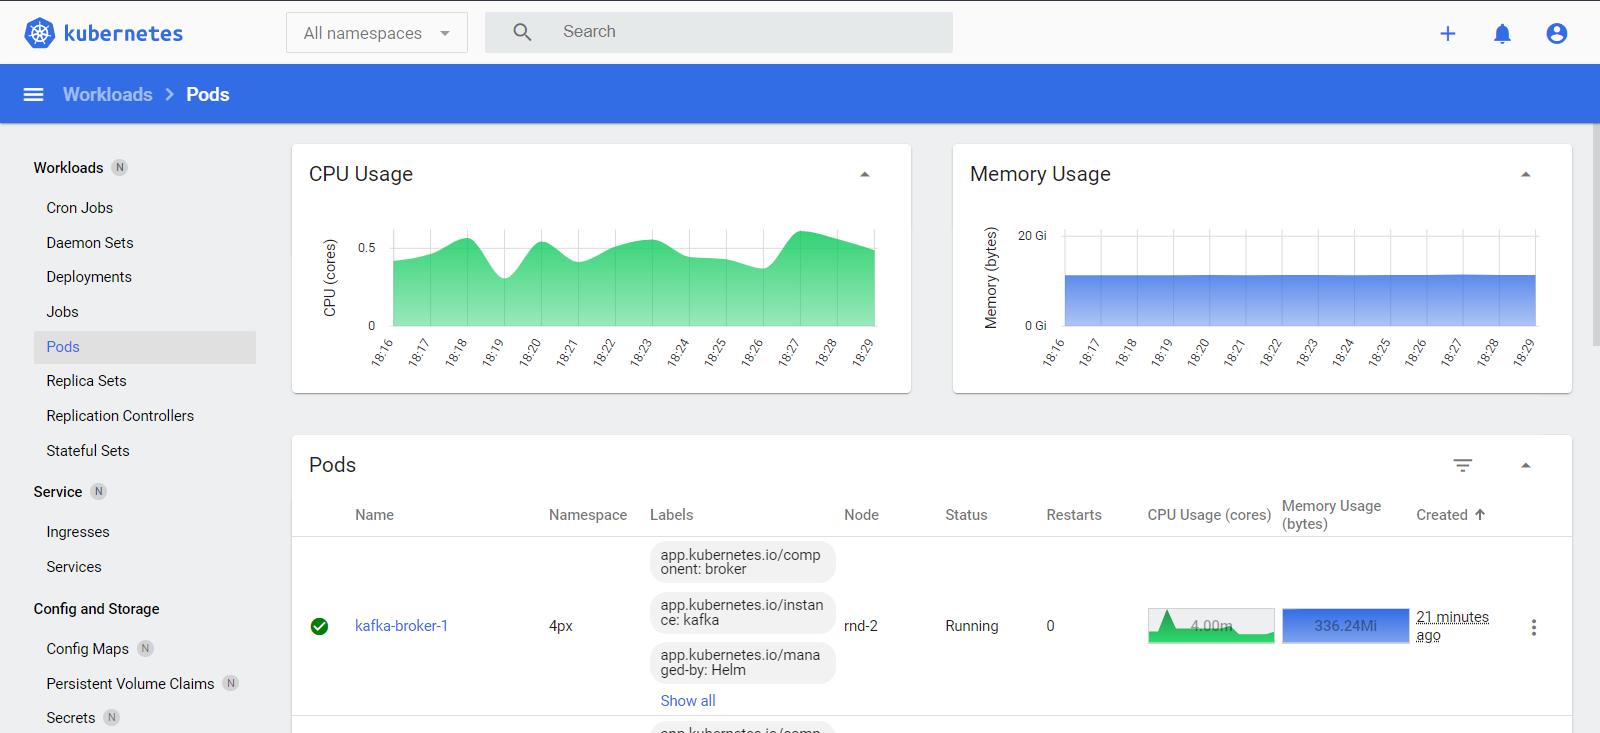
This guide will help you to understand the k8s dashboard and use it to manage and monitor your entire cluster. k8s dashboard consists of these things:
- Metrics Server (fetches data in k8s cluster and can be used as)
kubectl top nodes
kubectl top pods -n 4px
Metrics-Data-scraper (sends data from metrics server to k8s dashboard)
K8s dashboard (used to view all the metrics and monitor the pods and nodes created in the cluster) (https://<Master_Node-IP>:32001/)
All these things are deployed in one go from the setup file itself. All we need is a token and we can view our dashboards.
Steps To Login K8S Dashboard:
We need a create token, Run the below commands to create a Token for K8S Dashboards admin & viewer Users.
- Create Token for admin & viewer user:
- Admin Account:The service account we created has admin-level permissions. This user can view and edit resources in all namespaces. He can also monitor every action which is taken by an editor for a particular namespace.Command: For admin User Account Creation:
kubectl create token kube-ds-admin -n 4px --duration=8760h
- Viewer Account:The service account we created has viewer-level permissions. This user can view resources in a 4px namespace.Command: For Viewer User Account Creation:
kubectl create token kube-ds-viewer -n 4px --duration=8760h
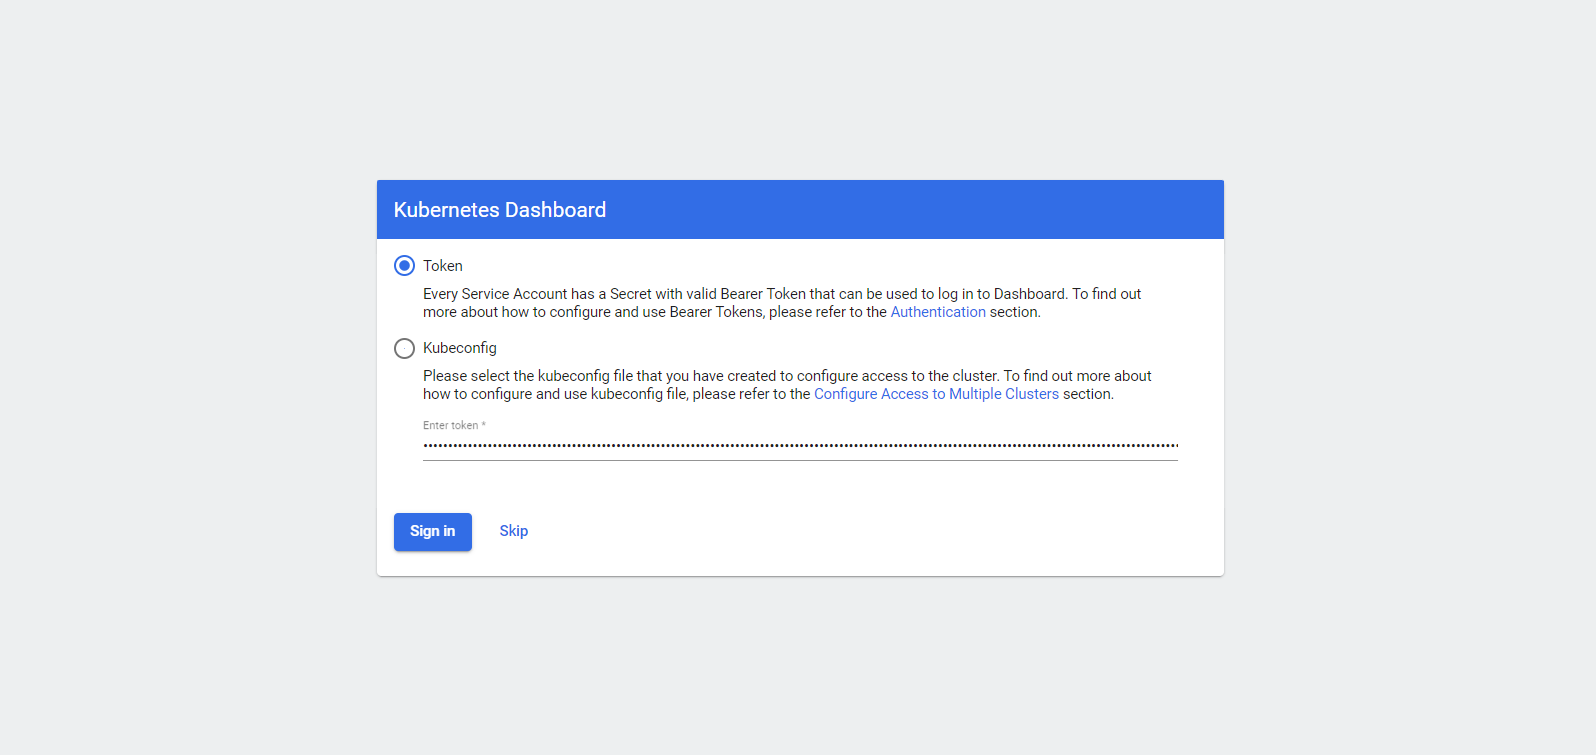
Navigate to the IP address https://<MASTER-IP>>:32001/, accept the warning and continue. Enter the token generated in the previous step.

