Alerts
The Alerts tab helps a Process Analyst explore all the alerts that are generated by the Watchers. Note that the Trigger Condition for an Alert is set inside a Watcher that is configured and managed in the Watchers tab.
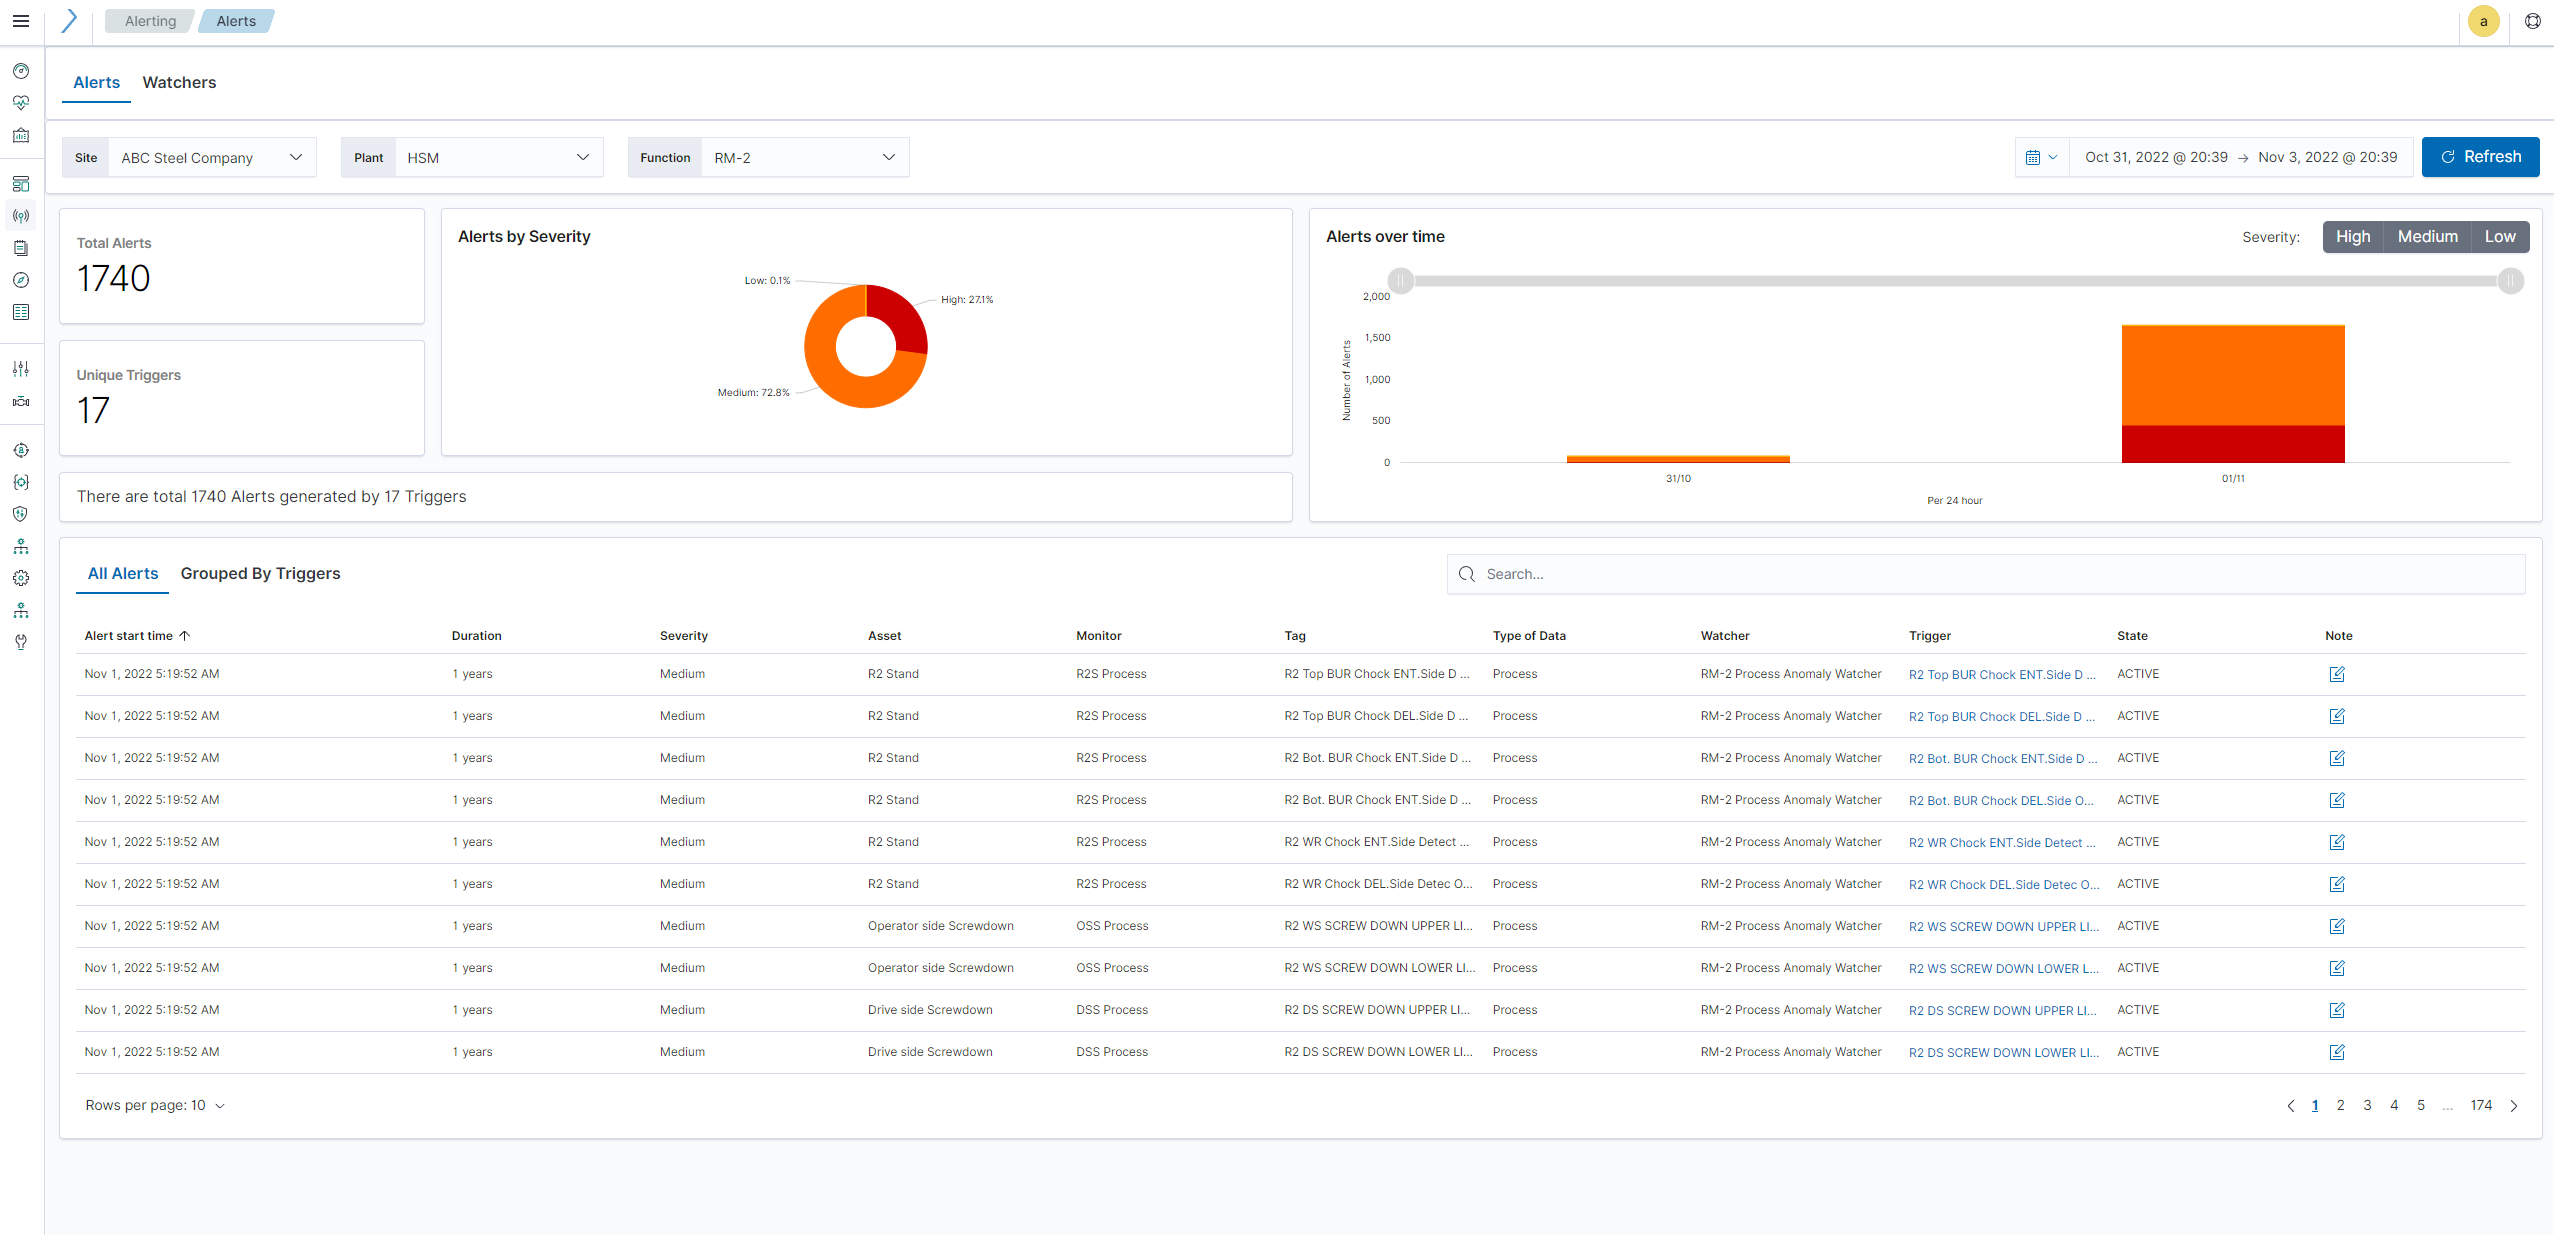
In this guide, we will walkthrough different sections of the Alerts tab, highlighting important features as shown in the screenshot below.

Filters
Site, Plant, Function, and Time Period
These dropdowns allow users to filter alerts based on specific sites, plants or functions. It helps narrow down the alerts for easier monitoring based on geographical or operational scope.
Example: Select “Site A” to only see alerts from that site.
Alert Metrics
Total Alerts
The cumulative number of alerts generated during the selected time period.
Unique Triggers
The count of distinct triggers that have generated alerts.
Example: If there are 100 alerts, but only 10 unique triggers, it indicates that some triggers are repeatedly generating alerts.
Charts
Alerts by Severity
A pie chart visually representing the breakdown of alerts into different severity levels (e.g., Low, Medium, High).
Example: You can quickly see if most alerts are of high severity and may need urgent attention.
Alerts Over Time
A bar chart showing the number of alerts generated over a period, helping you track trends and spikes in alert volume.
Example: A sharp rise in alerts on a particular date could indicate a critical issue that needs immediate investigation.
Alert Details
All Alerts
Displays all alerts with details such as:
Start Time: When the alert was first triggered.
Duration: How long the alert has been active.
Severity: The level of urgency (Low, Medium, High).
Asset: The specific asset related to the alert.
Monitor, Watcher, Trigger: Additional details about the system components that caused the alert.
State: Current status (e.g., Active, Completed).
Notes: Any notes related to the alert.
Example: If you see an alert with a “High” severity that has been active for a long duration, it may require immediate attention.
Note
Trigger Link (in blue)What it does: Clicking on the blue trigger name will take you to the details of the alerts associated with that specific trigger (explained further in section 3).
Grouped by Triggers

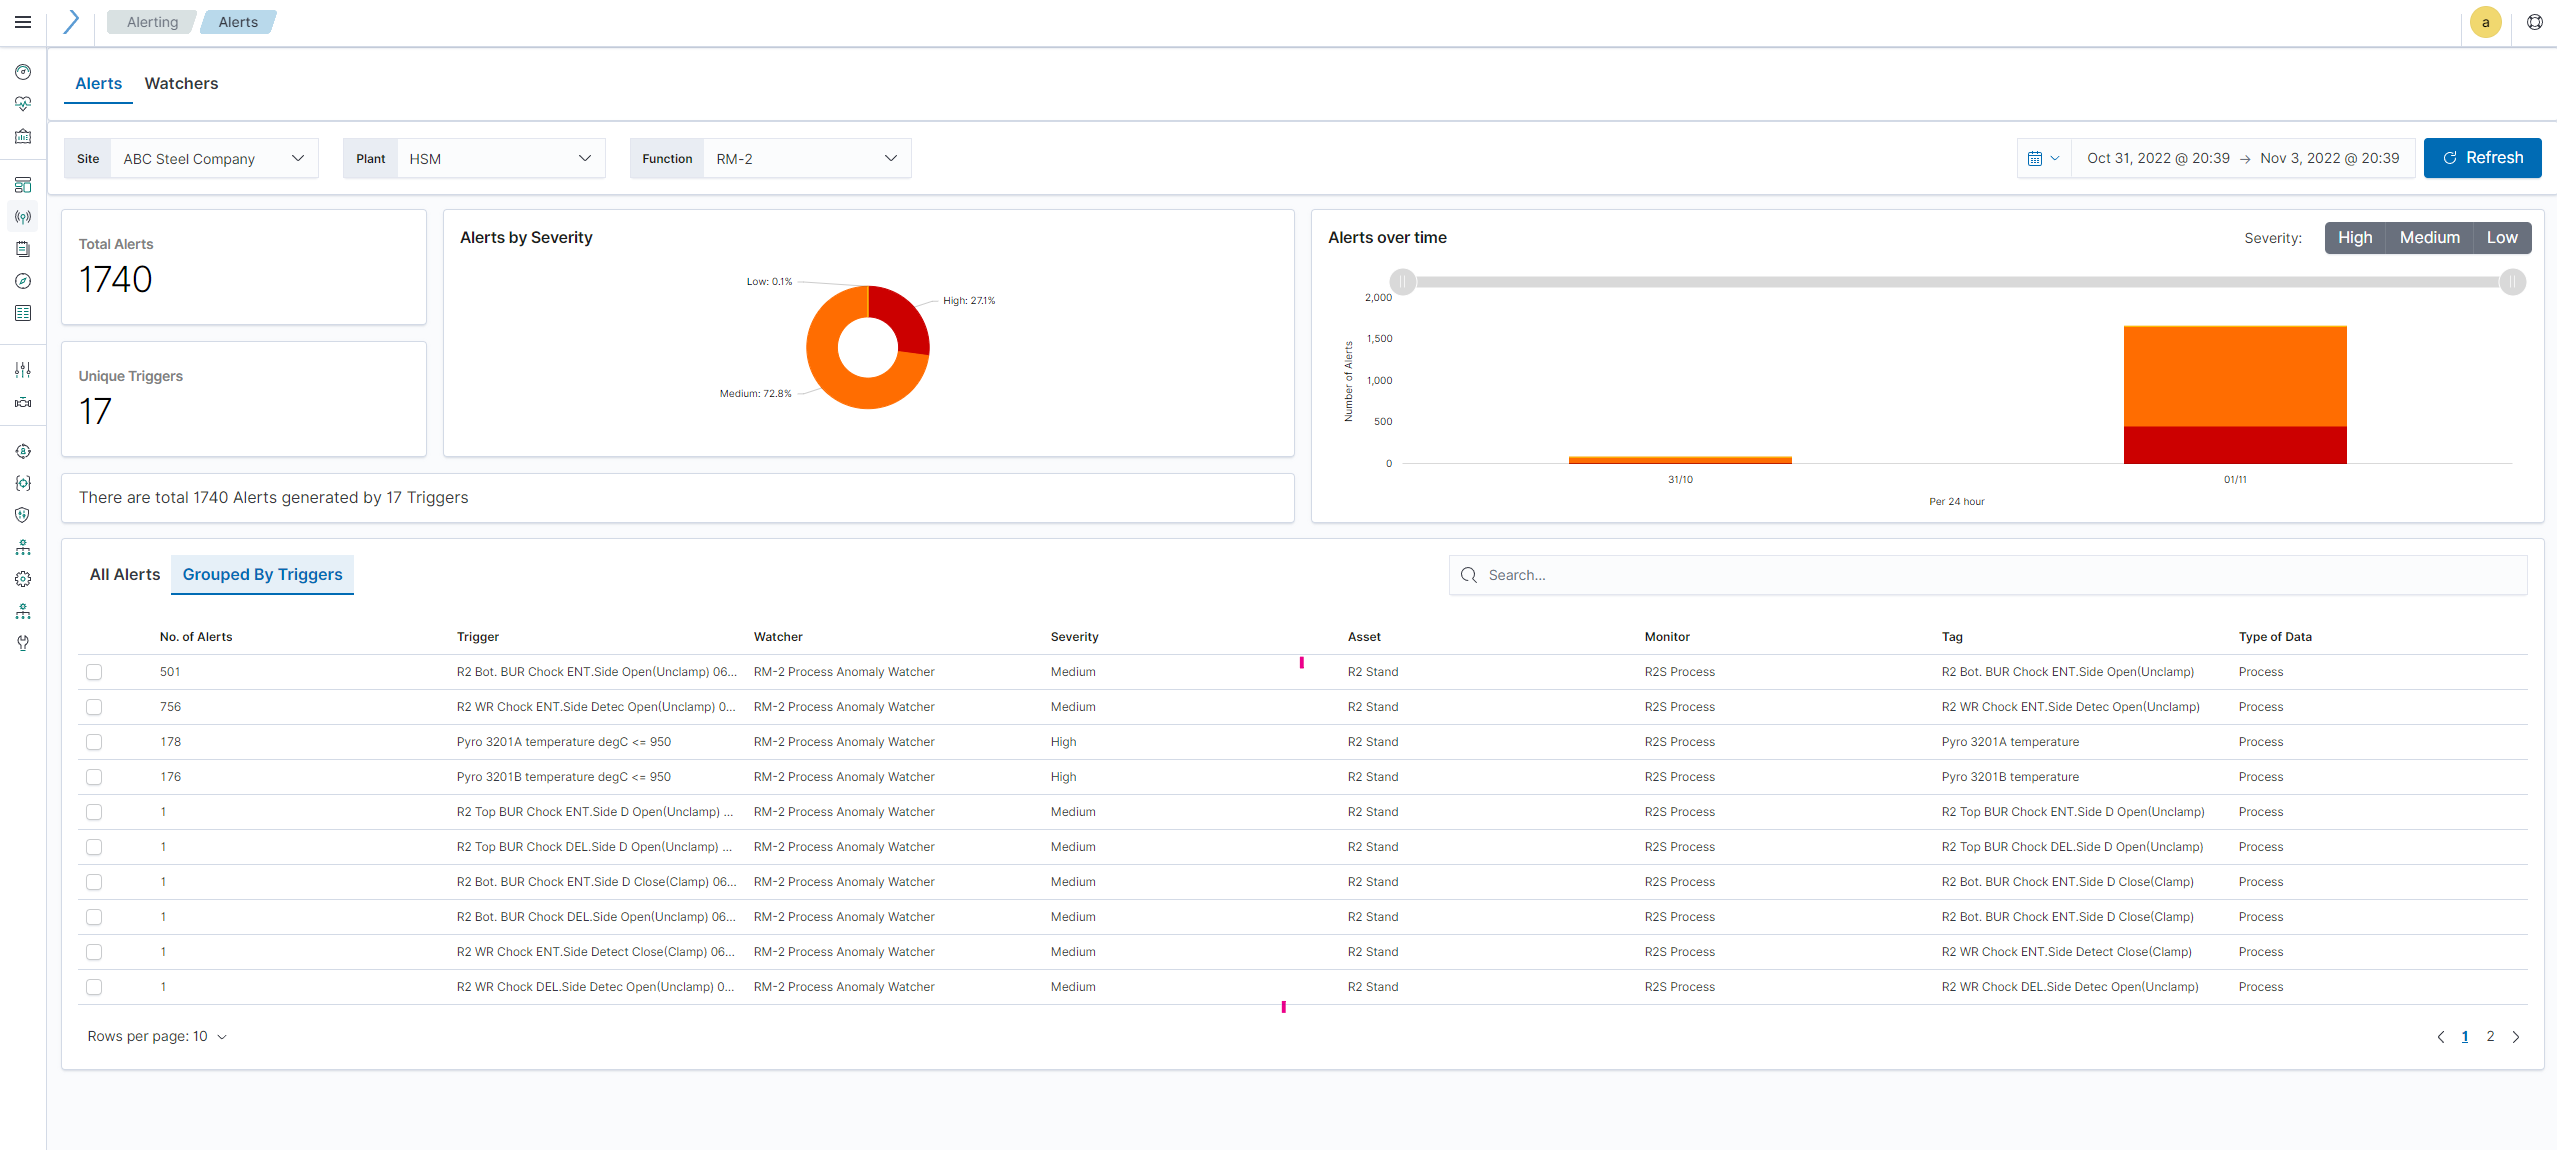
In the Group by Triggers view, the alerts are grouped based on their respective Triggers. The main sections here are:
Trigger Name: The name of the trigger causing the alert.
Severity: The highest severity associated with this trigger.
Number of Alerts: How many alerts this trigger has generated.
Related Monitor/Watcher: Additional context about which monitor or watcher this alert is associated with.
Example: If a single trigger is associated with many high-severity alerts, it may point to a recurring issue needing resolution.
Trigger Drilldown

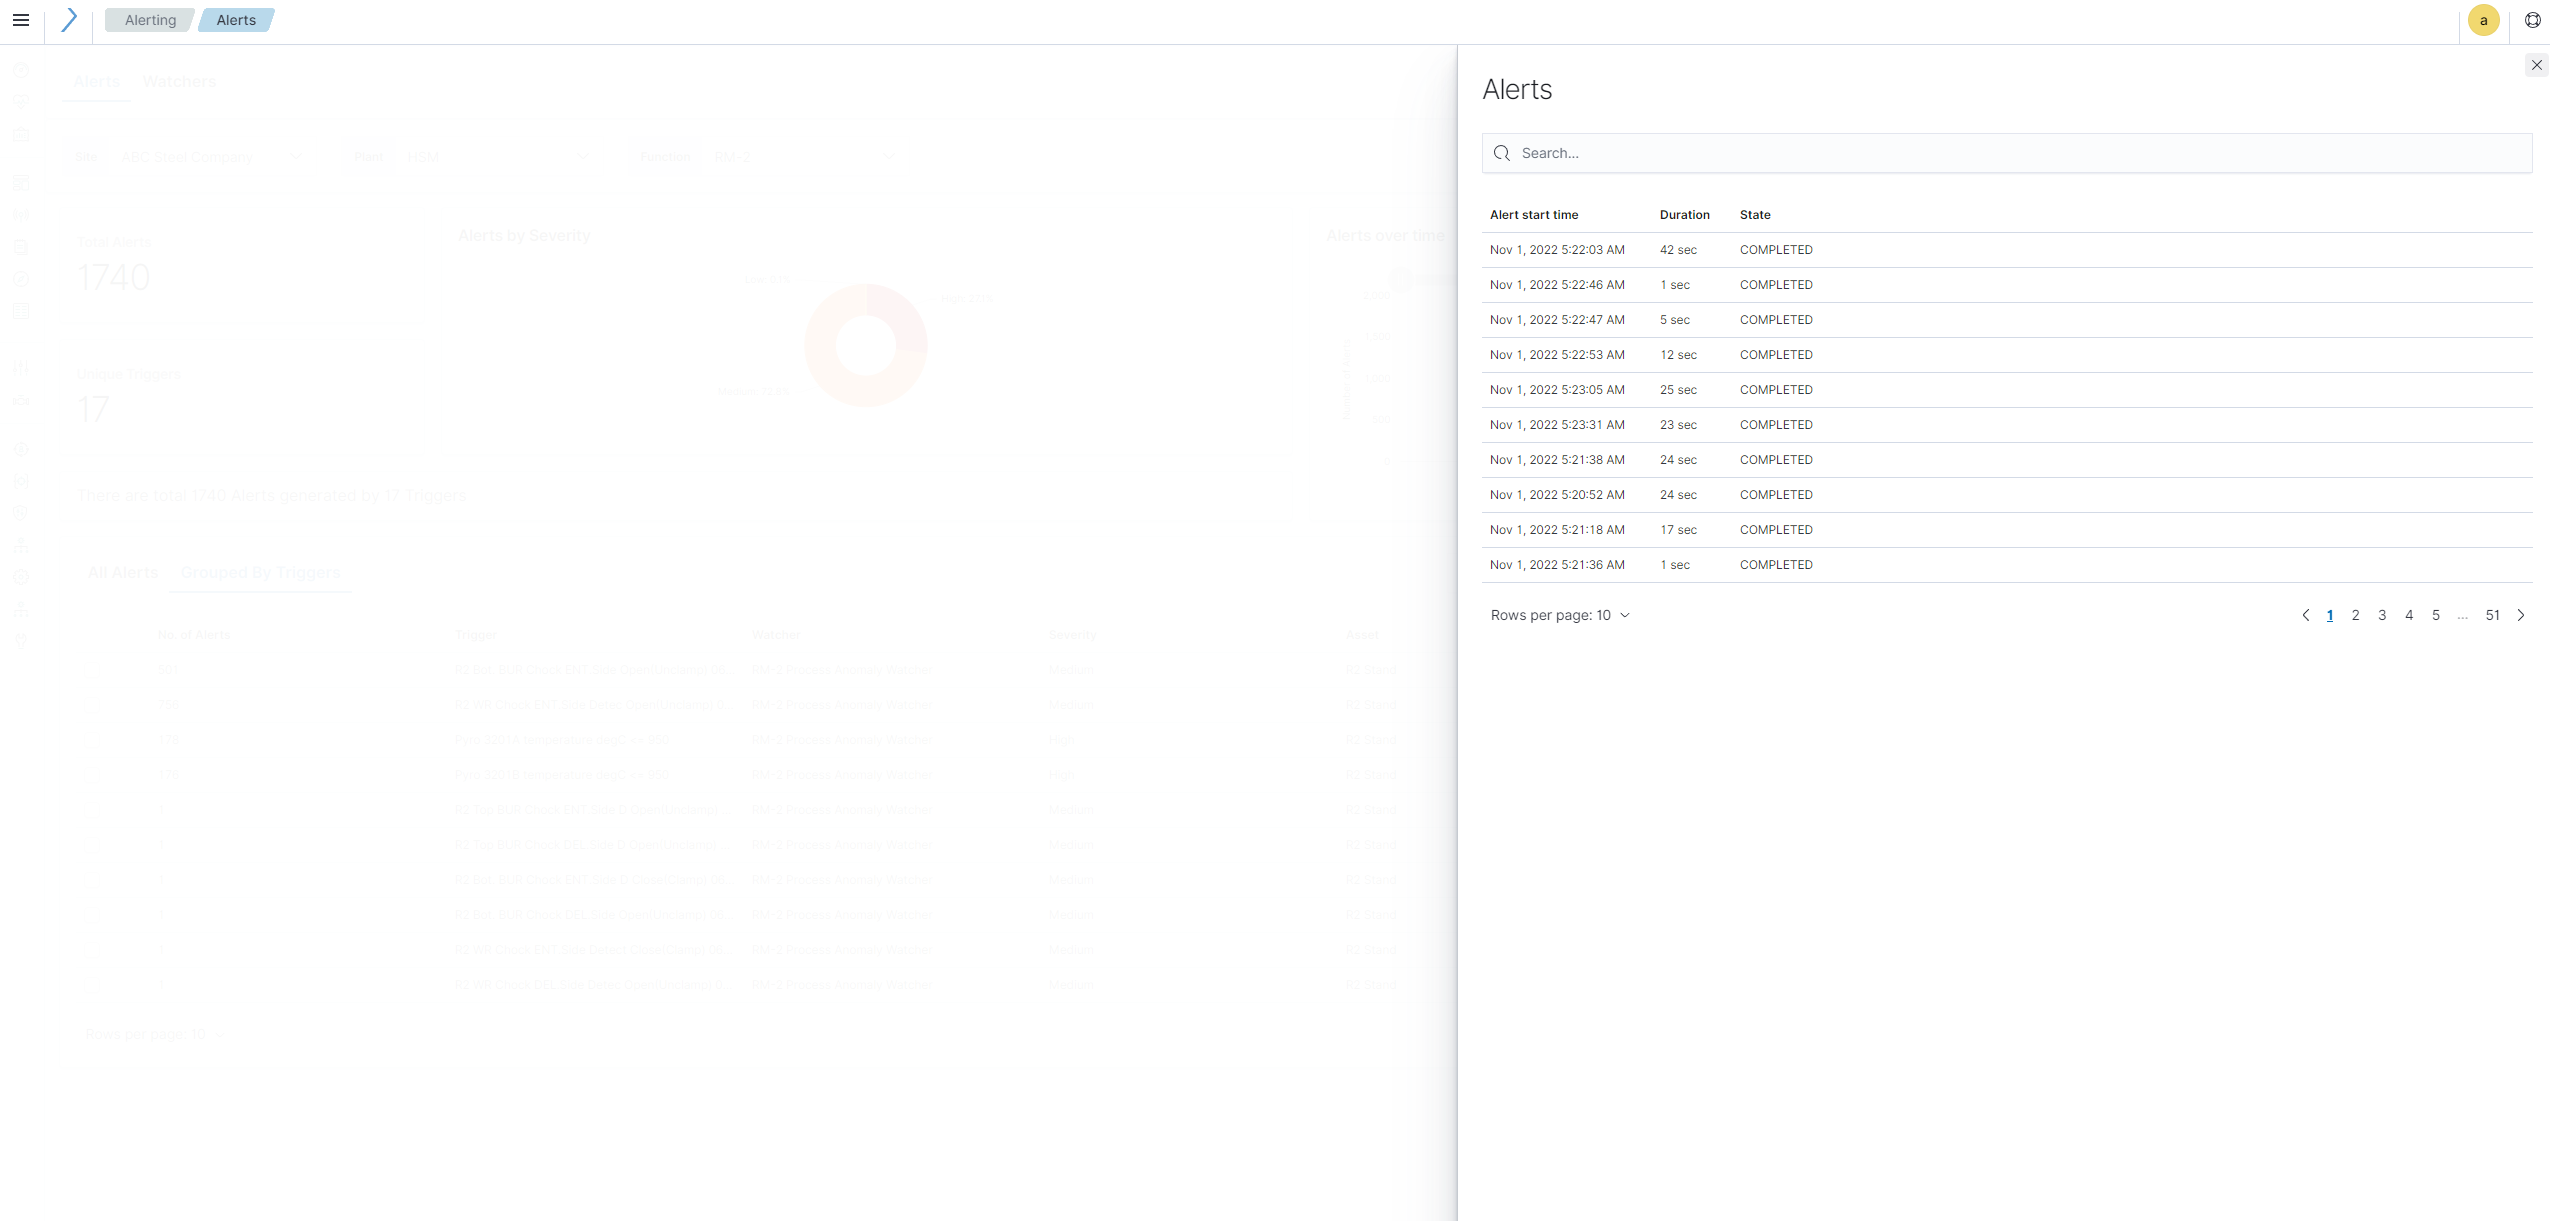
Click on the last column ‘Overview’ button to see a detailed list of all alerts tied to that Trigger.
Alert Timeline
- What it does: Shows a chronological timeline of alerts generated by the specific trigger. It includes:
Start Time: The time the alert was generated.
Duration: How long has the alert been active?
State: The current status (e.g., Active, Completed).
Example: You can use this to track the frequency of alerts and see how quickly issues are resolved or if they persist.
Alert List (Detailed View)
What it does: This section lists out detailed information for each alert triggered under the specific trigger, similar to the alerts table in the “All Alerts” view but focused on just one trigger.
Example: If one specific alert keeps recurring, you can investigate deeper to understand why.
Trigger Selection
The selection of row will filter the ‘Alerts over Time’ chart for the selected Trigger.