User Guide: Idle Energy Monitoring
Overview
The Idle Energy feature enables you to track energy consumption during periods of inactivity across your site and plant. This information can help pinpoint potential savings and enhance energy efficiency.
Key Data Displays
Idle Energy Summary
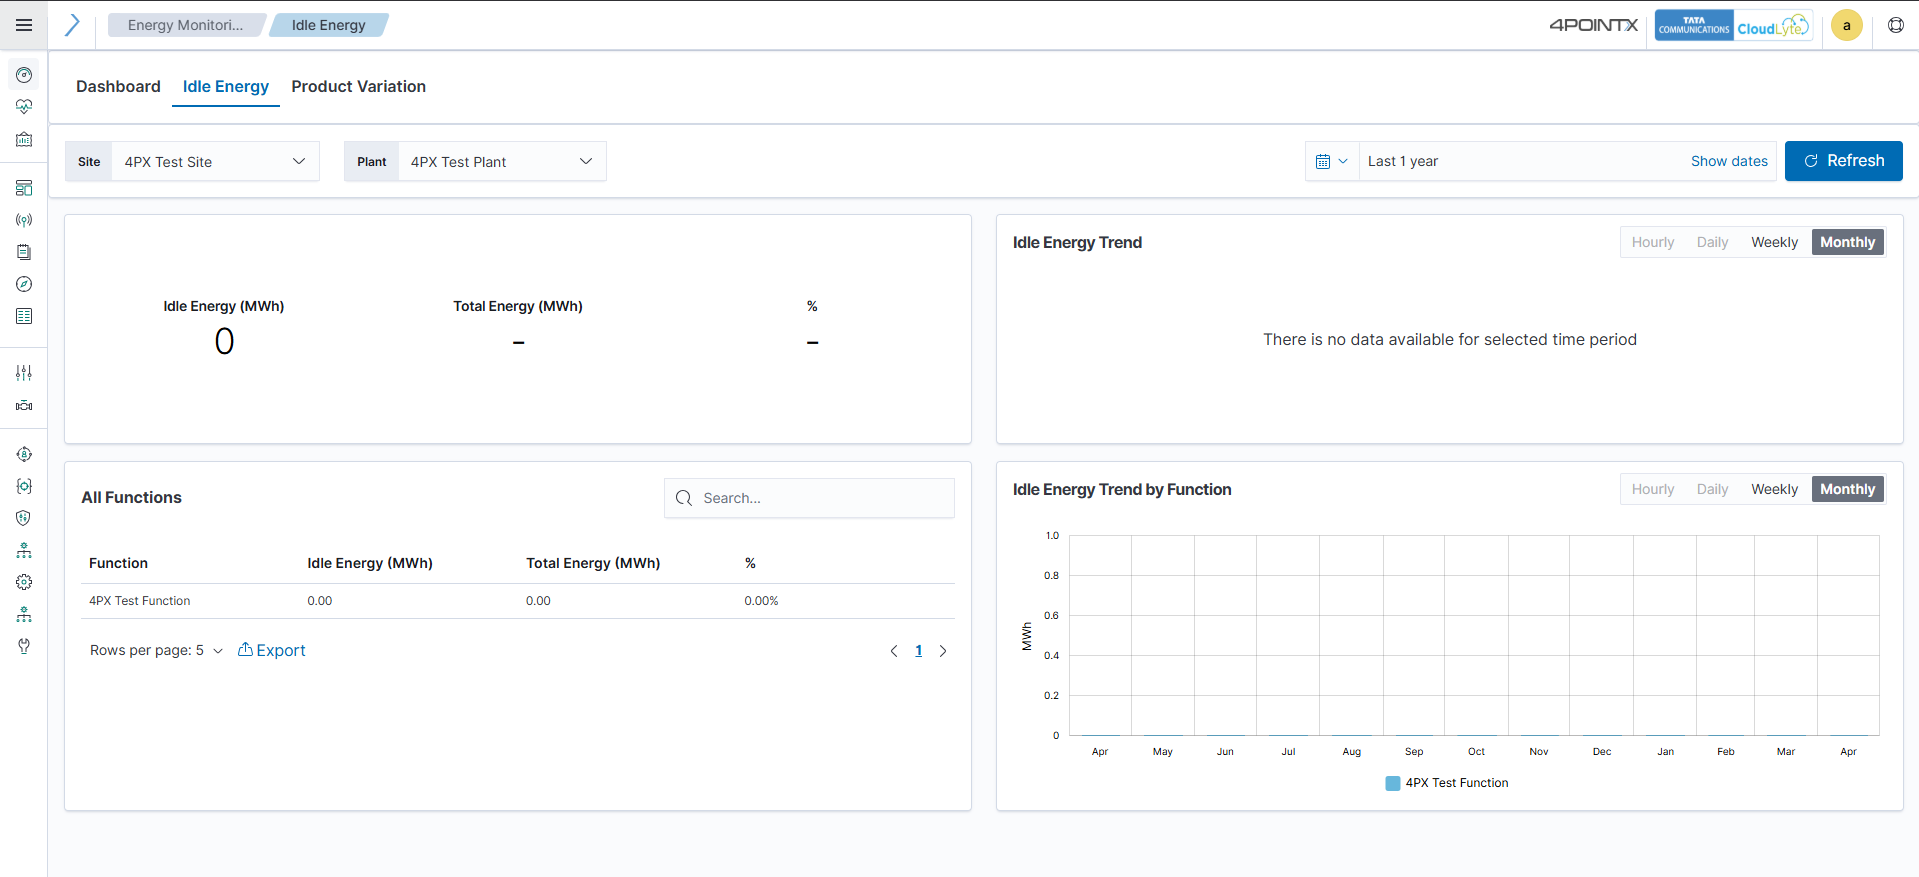
This section presents essential metrics for idle energy consumption:
Idle Energy (MWh): The total energy consumed while the system is idle.
Total Energy (MWh): The overall energy consumption, encompassing both active and idle usage.
Percentage: The proportion of total energy consumption attributed to idle energy.
This summary provides a quick snapshot of idle energy as a fraction of your total energy usage.
Idle Energy Trend
The Idle Energy Trend chart visually illustrates how idle energy fluctuates over time. You can adjust the time period of the chart using various filters:
Hourly
Daily
Weekly
Monthly
This feature enables you to analyze idle energy consumption trends across different timeframes, helping you identify patterns and potential inefficiencies.
All Functions
This section features a detailed table of idle energy data categorized by function. It includes the following columns:
Function Name: The specific function or area of operation.
Idle Energy (MWh): The idle energy consumption for each function.
Total Energy (MWh): The total energy consumption for each function.
Percentage: The percentage of total energy consumption attributed to idle energy for each function.
You can search for specific functions using the search bar at the top of the table. The table also supports pagination, allowing you to navigate through larger datasets.
Additionally, you can export the data by clicking the Export button, which generates a downloadable file of the current table's data for further analysis or record-keeping.
Idle Energy Trend by Function
This chart displays the trend of idle energy consumption by function over time. You can filter this chart by:
Hourly
Daily
Weekly
Monthly
This view allows you to compare the idle energy consumption of different functions over your selected time period.
How to Use the Idle Energy Tab Effectively
Track and Compare Trends: Utilize the trend charts to identify patterns in idle energy consumption and compare different timeframes (hourly, daily, weekly, monthly).
Optimize Energy Efficiency: The Idle Energy Summary provides an overview of energy wastage. If you observe high idle energy percentages, investigate specific functions to determine where energy consumption exceeds expectations.
Export Data for Reporting: The export feature in Box 3 allows you to download detailed data, which can be beneficial for reporting, analysis, or audits.
Monitor Specific Functions: The function-specific data enables you to delve into the efficiency of individual processes. Look for trends in energy usage by function to optimize operations.